asciigraph alternatives and similar packages
Based on the "Advanced Console UIs" category.
Alternatively, view asciigraph alternatives based on common mentions on social networks and blogs.
-
-
Rich Interactive Widgets for Terminal UIs
Terminal UI library with rich, interactive widgets — written in Golang -
-
-
tcell
Tcell is an alternate terminal package, similar in some ways to termbox, but better in others. -
pterm
✨ #PTerm is a modern Go module to easily beautify console output. Featuring charts, progressbars, tables, trees, text input, select menus and much more 🚀 It's completely configurable and 100% cross-platform compatible. -
termtables
DISCONTINUED. A Go port of the Ruby library terminal-tables for simple ASCII table generation as well as providing markdown and HTML output -
chalk
Intuitive package for prettifying terminal/console output. http://godoc.org/github.com/ttacon/chalk -
GCli
🖥 Go CLI application, tool library, running CLI commands, support console color, user interaction, progress display, data formatting display, generate bash/zsh completion add more features. Go的命令行应用,工具库,运行CLI命令,支持命令行色彩,用户交互,进度显示,数据格式化显示,生成bash/zsh命令补全脚本 -
yacspin
Yet Another CLi Spinner; providing over 80 easy to use and customizable terminal spinners for multiple OSes -
-
ctc
Console Text Colors - The non-invasive cross-platform terminal color library does not need to modify the Print method -
crab-config-files-templating
Dynamic configuration file templating tool for kubernetes manifest or general configuration files

WorkOS - The modern identity platform for B2B SaaS


Do you think we are missing an alternative of asciigraph or a related project?


README
asciigraph

![]()

![]()
![]()
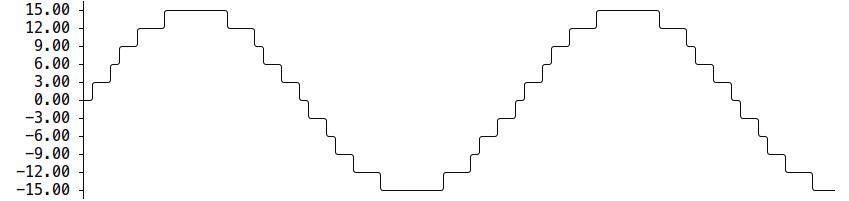
Go package to make lightweight ASCII line graphs ╭┈╯.
Installation
go get github.com/guptarohit/asciigraph
Usage
Basic graph
package main

import (
    "fmt"
    "github.com/guptarohit/asciigraph"
)

func main() {
    data := []float64{3, 4, 9, 6, 2, 4, 5, 8, 5, 10, 2, 7, 2, 5, 6}
    graph := asciigraph.Plot(data)

    fmt.Println(graph)
}
Running this example would render the following graph:
  10.00 ┤        ╭╮
   9.00 ┤ ╭╮     ││
   8.00 ┤ ││   ╭╮││
   7.00 ┤ ││   ││││╭╮
   6.00 ┤ │╰╮  ││││││ ╭
   5.00 ┤ │ │ ╭╯╰╯│││╭╯
   4.00 ┤╭╯ │╭╯   ││││
   3.00 ┼╯  ││    ││││
   2.00 ┤   ╰╯    ╰╯╰╯
Command line interface
This package also brings a small utility for command line usage.
Assuming $GOPATH/bin is in your $PATH, simply go get it then
install CLI.
CLI Installation
go install github.com/guptarohit/asciigraph/cmd/asciigraph
or download binaries from the releases page.
Feed it data points via stdin:
$ seq 1 72 | asciigraph -h 10 -c "plot data from stdin"
  72.00 ┼
  65.55 ┤                                                                  ╭────
  59.09 ┤                                                           ╭──────╯
  52.64 ┤                                                    ╭──────╯
  46.18 ┤                                             ╭──────╯
  39.73 ┤                                      ╭──────╯
  33.27 ┤                              ╭───────╯
  26.82 ┤                       ╭──────╯
  20.36 ┤                ╭──────╯
  13.91 ┤         ╭──────╯
   7.45 ┤  ╭──────╯
   1.00 ┼──╯
           plot data from stdin
Realtime graph for data points via stdin:
$ ping -i.2 google.com | grep -oP '(?<=time=).*(?=ms)' --line-buffered | asciigraph -r -h 10 -w 40 -c "realtime plot data (google ping in ms) from stdin"

Acknowledgement
This package started as golang port of asciichart.
Contributing
Feel free to make a pull request! :octocat:
*Note that all licence references and agreements mentioned in the asciigraph README section above
are relevant to that project's source code only.